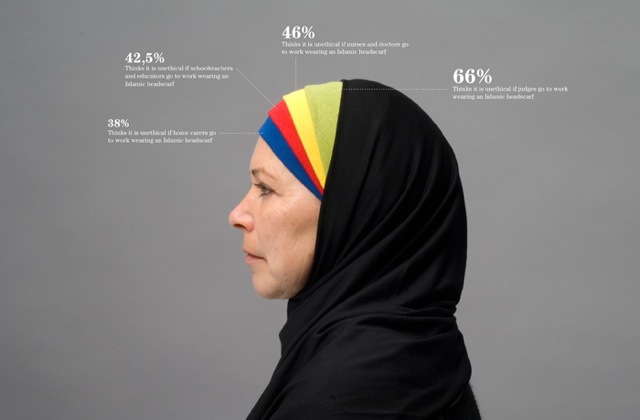
Peter Ørntoft created a series of people representing graphs in his series of Informationgraphics in context.
The project deals with data from a list of the social related interests of the Danish people. The list is the result of an opinion poll from a major consultancy company in Denmark. I have used the context of specific opinion polls within each interest to shape and design diagrams. By doing so the receiver understands more layers of information about the data.
Interest no.4 is refugees and immigrants. The focus of the interest deals with whether or not the Danes think its ethical to wear religious symbols in public professions. I have used the looks and appearances of traditional religious symbols to design the diagrams explaining the data.


