Explaining Exponential Growth and Epidemics
With the increasing spread of COVID-19 (Coronavirus) around the world, mathematician Grant Sanderson of 3Blue1Brown very handily explained the correlation between exponential and logistic growth in regard to epidemics. Sanderson explains that this process goes from one day to the next, multiplying every 24 hours by a constant, such as the number of diagnosed cases per day.
The phrase “exponential growth” is familiar to most people, and yet human intuition has a hard time really recognizing what it means sometimes. We can anchor on a sequence of small seeming numbers, then become surprised with suddenly those numbers look big, even if the overall trend follows an exponential perfectly consistently. This right here is the data for recorded cases of COVID-19, aka the Coronavirus, outside mainland China, at least as of the time I’m writing this. Never one to waste an opportunity for a math lesson, I thought this might be a good time for us all to go back to the basics on what exponential growth is, where it comes from, what it implies, and maybe most pressingly, how to know when it’s coming to an end.
Sanderson further explains that viruses have their own timeline and aren’t keen to follow a formula.
While this video uses COVID-19 (what we’re all calling “Coronavirus”) as a motivating example, the main goal is simply a math lesson on exponentials and logistic curves.
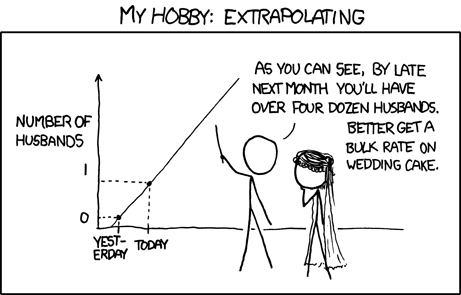
And here’s xkcd’s take.