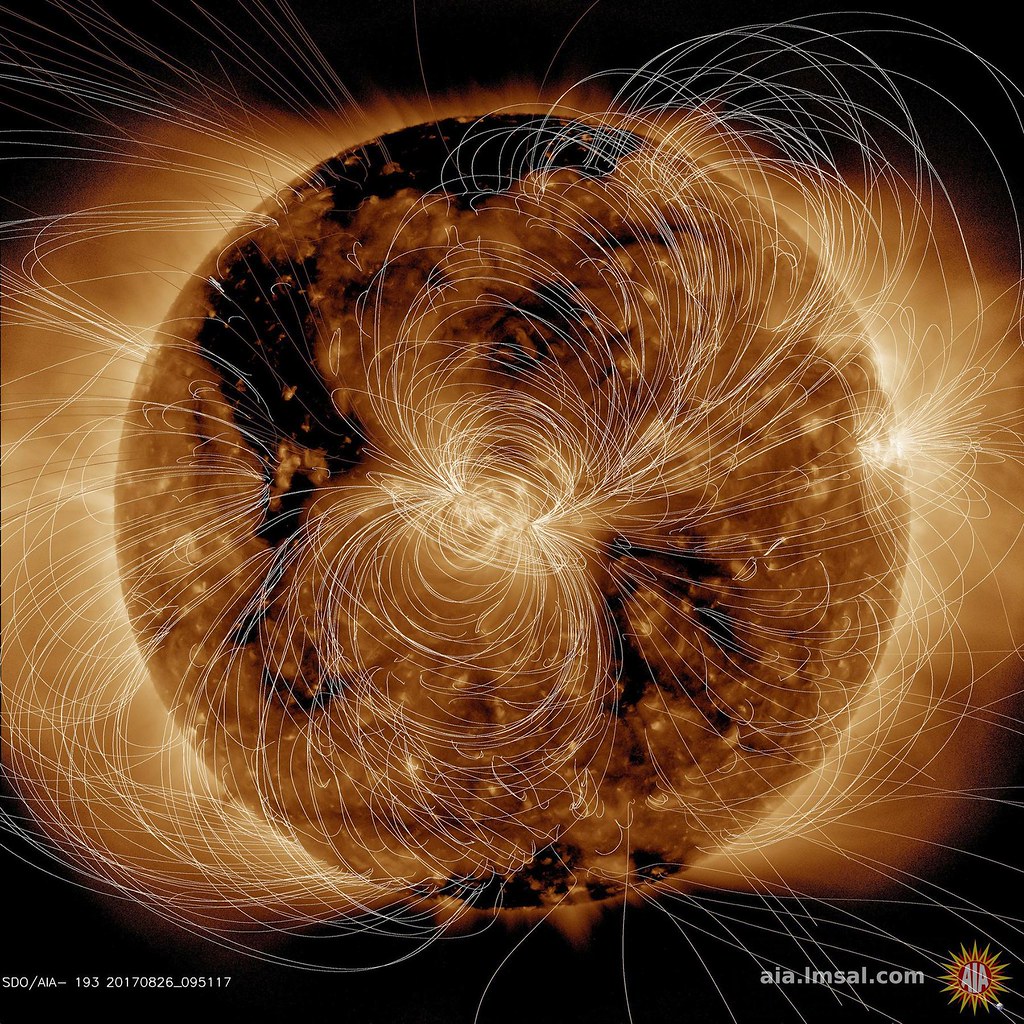
A Gorgeous Computer Generated Visualization of the Sun’s Magnetic Field on August 10, 2018
Scientists at the NASA Solar Dynamics Observatory (SDO) used daily scientific data to create an absolutely gorgeous computer generated visualization showing what the magnetic field of the sun looked like on August 10, 2018. They further clarified the image by superimposing defining lines so that viewers can easily spot the different areas of the fields.
We took the opportunity to compare an extreme ultraviolet view of the sun with the same image showing the superimposed field lines. The bright active region right at the central area of the sun clearly shows a concentration of field lines, as well as the small active region at the sun’s right edge, but to a lesser extent. Magnetism drives the dynamic activity near the sun’s surface


