Skip to content
No results
  • About
  • FAQ
  • Hosting
  • Newsletter
  • Socials
  • Support
  • Contact
Laughing Squid
  • About
  • FAQ
  • Hosting
  • Newsletter
  • Socials
  • Support
  • Contact
No results
Laughing Squid

A Series of Interactive Charts Detailing Migration Within the United States by State

  • Rollin BishopRollin Bishop
  • August 15, 2014

California Migration

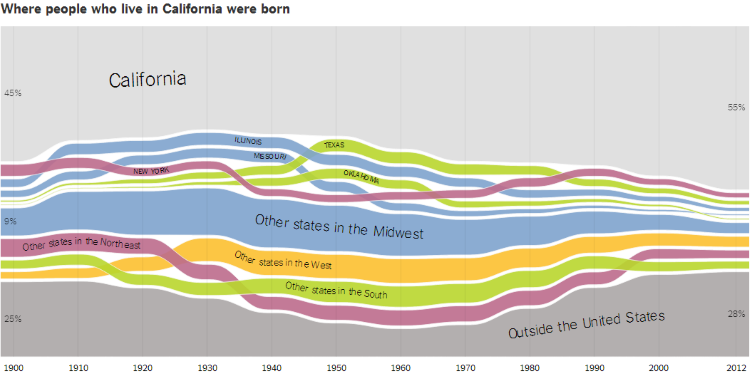
The Upshot over at The New York Times has posted a series of interactive charts detailing migration within the Unites States by state. The charts, which begin at 1900, were created using microdata from the United States Census Bureau gathered from the University of Minnesota’s Minnesota Population Center.

Related Posts

Rollin Bishop
Rollin Bishop


  • Facebook
  • Bluesky
  • Threads
  • Mastodon
Check out our Managed WordPress Hosting
Laughing Squid Hosting

Trending on Laughing Squid

  • A 3D Animated Reconstruction of the Vibrant City of Pompeii Before the Mount Vesuvius Eruption
    A 3D Animated Reconstruction of the Vibrant City of Pompeii Before the Mount Vesuvius Eruption
  • A Munchkin Cat Who Has the Body of a Kitten and the Wise Face of an Old Soul
    A Munchkin Cat Who Has the Body of a Kitten and the Wise Face of an Old Soul
  • Rescued Husky Experiences Snow for the First Time
    Rescued Husky Experiences Snow for the First Time
  • Man With Super-Fast Hands Can Grab Anything Faster Than the Blink of an Eye
    Man With Super-Fast Hands Can Grab Anything Faster Than the Blink of an Eye
  • A Giant Stir-Fry Machine That Automatically Prepares Large Batches of Fried Rice and Noodle Dishes
    A Giant Stir-Fry Machine That Automatically Prepares Large Batches of Fried Rice and Noodle Dishes
Our blog posts may contain affiliate links. If you make a purchase through our site, we may earn a small commission.

Privacy Policy | Terms of Service
Accessibility Statement | Affiliate Disclosure

Powered by Laughing Squid Hosting and WordPress VIP
© 1995-2026 Laughing Squid LLC, all rights reserved