Geotagged Tweets Visualized as Topographic Maps
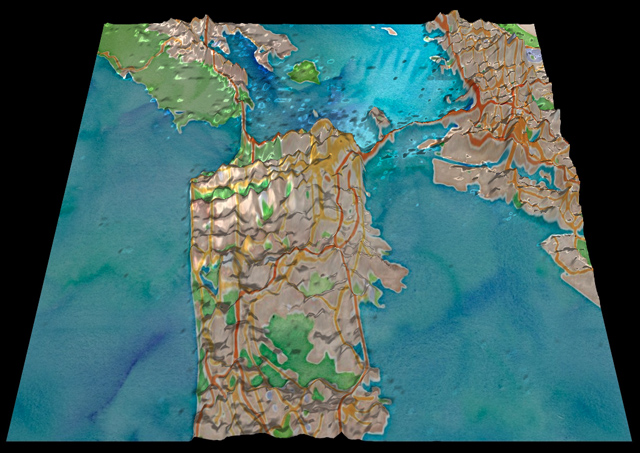
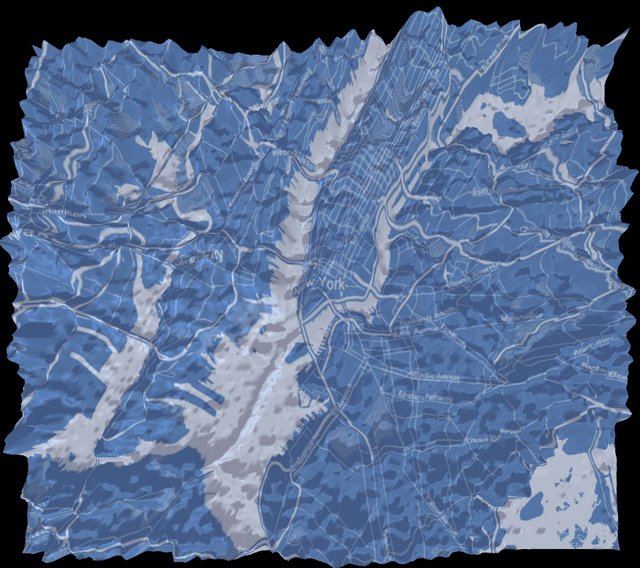
Nicolas Belmonte, a data visualization scientist at Twitter, created a series of interactive data visualizations that show geotagged tweets as topographic maps. The mountainous high points on the maps correspond with areas of high tweet density. Densely populated areas are clearly visible, as are high traffic corridors such as bridges and ferry routes. Belmonte has created visualizations for New York City, San Francisco, and Istanbul.


