Google has just launched Trends for Websites, the latest addition to the Google Trends suite of tools, where you can created traffic graphs for websites based on daily unique visitors measured by Google.
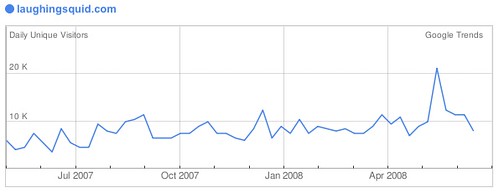
Here’s what the Google Trends graph looks like for Laughing Squid.
You can even compare the traffic of multiple websites, for instance:
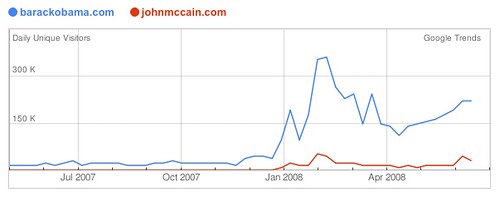
Here’s the graph for barackobama.com vs. johnmccain.com.
Here Are A Few Related Posts You Might Enjoy:
- Add Google Maps to Websites With New Embed Feature
- Google & Volkswagen Ads Showing Building of Giant of Websites
- Thomas Hawk’s Last 320 Websites
- Worldwide Lexicon Firefox Translator Enables You To View Websites In Other Languages
- Freakshow, Honest Reviews of Web 2.0 Websites


{ 1 comment… read it below or add one }
funny, when I use it doesn’t indicate the legend. I can’t see how many uniques the horizontal lines indicate.
But much more interesting are the commenters who correctly point out that all google do not returrn results