Skip to content
No results
  • About
  • FAQ
  • Hosting
  • Newsletter
  • Socials
  • Support
  • Contact
Laughing Squid
  • About
  • FAQ
  • Hosting
  • Newsletter
  • Socials
  • Support
  • Contact
No results
Laughing Squid

Back to the Future Retold in a Simple Chart

  • Justin PageJustin Page
  • January 19, 2018

Back to the Future as a Chart

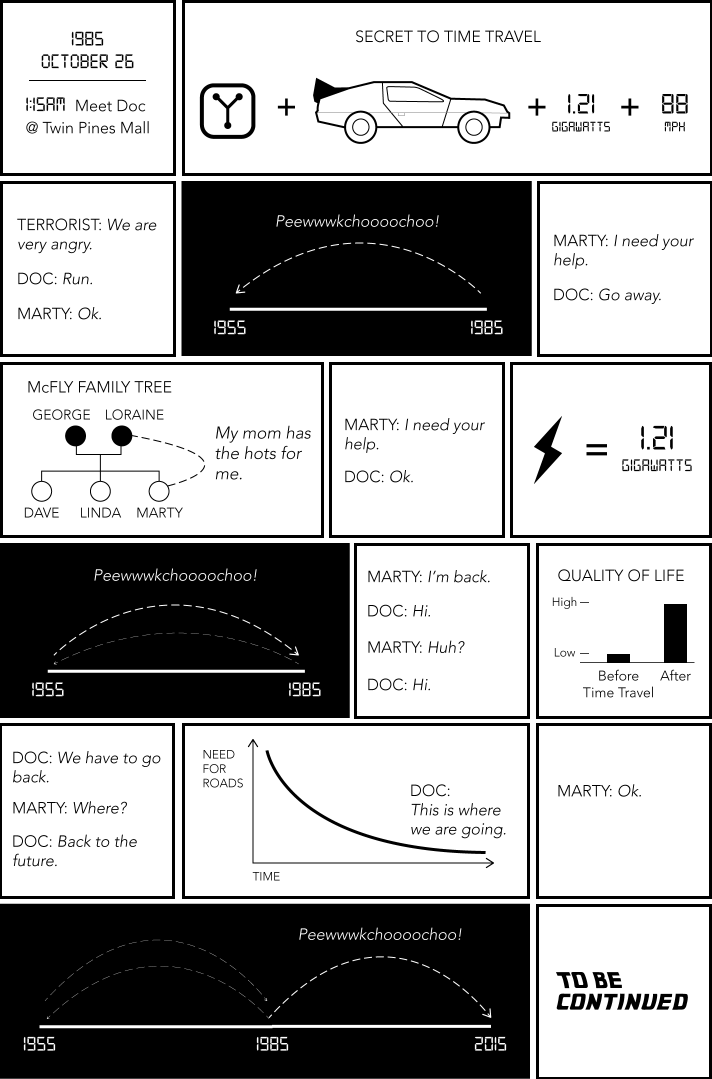
Statistician Dr. Nathan Yau of Flowing Data has created a simple chart that retells a compact version of the Back to the Future plot.

via Flowing Data

Related Posts

Justin Page
Justin Page

I'm a geeky artist/blogger who loves his life, wife, two identical twin girls, family, friends, and job.


  • Facebook
  • Bluesky
  • Threads
  • Mastodon
Check out our Managed WordPress Hosting
Laughing Squid Hosting

Trending on Laughing Squid

  • A Lively Split-Screen Cover of 'I Get Around' by The Beach Boys
    A Lively Split-Screen Cover of 'I Get Around' by The Beach Boys
  • Why Ships and Planes Measure Speed in Knots Instead of Miles or Kilometers per Hour
    Why Ships and Planes Measure Speed in Knots Instead of Miles or Kilometers per Hour
  • Cheerless Rehomed Cockatoo Finds Joy With a Dedicated Human Who Reads and Sings to Him
    Cheerless Rehomed Cockatoo Finds Joy With a Dedicated Human Who Reads and Sings to Him
  • Why Office Chairs Have Five Legs Instead of Four
    Why Office Chairs Have Five Legs Instead of Four
  • A Chilling Look at How Urban Dwellers in 1978 Might Survive Without Modern Technology
    A Chilling Look at How Urban Dwellers in 1978 Might Survive Without Modern Technology
Our blog posts may contain affiliate links. If you make a purchase through our site, we may earn a small commission.

Privacy Policy | Terms of Service
Accessibility Statement | Affiliate Disclosure

Powered by Laughing Squid Hosting and WordPress VIP
© 1995-2026 Laughing Squid LLC, all rights reserved