guest post by Laszlo Thoth

Accurate Pie Chart

image by Laszlo Thoth

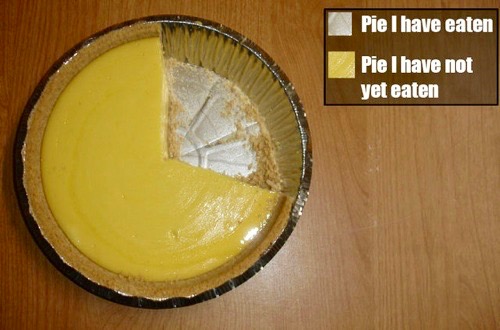
I made this creative commons licensed picture of an Accurate Pie Chart in early 2007. Kathryn Hill baked the pie, a key lime with graham cracker crust. It was delicious.


filed under Food, Humor

This website uses IntenseDebate comments, but they are not currently loaded because either your browser doesn't support JavaScript, or they didn't load fast enough.

{ 17 comments… read them below or add one }

Dave Schumaker August 11, 2009 at 2:14 pm

Genius!

Myke August 12, 2009 at 5:48 pm

Make sense!

B. Peregrine August 13, 2009 at 9:43 am
JohnTEQP August 14, 2009 at 10:16 am

Best pie chart ever.

jahsa August 14, 2009 at 10:19 am

For some reason I found this hilariously funny and laughed so loud my wife thought I was sobbing and came upstairs

Michael Blix August 14, 2009 at 10:25 am

I don’t get it. A piece of the pie is missing.

N August 14, 2009 at 10:41 am

This chart is inaccurate. What evidence do you have that you actually ate the pie and what evidence is there that YOU will consume the rest. These kind of pie charts mislead the public and create an atmosphere of distrust and suspicion. This is why healthcare reform will fail.

Ryan August 14, 2009 at 11:16 am

This graph is highly inaccurate. The silver portion only represents the amount of pie removed from the tin, not necessarily the amount eaten.

Harald Walker August 14, 2009 at 1:06 pm

Another proof that pies are made for eating and not for charting.

Tim August 14, 2009 at 1:43 pm

You obviously haven’t done anything to account for rounding errors.

Porcupine_Pal August 14, 2009 at 1:58 pm

keep the government out of pie charts!

rbloom August 14, 2009 at 2:18 pm

Father Guido, is that you?

James Grenning August 14, 2009 at 2:49 pm

If a pie’s area is pi*r^2 and that is an 8″ pie pan. this chart makes it clear that you have about 33 square inches of pie to go.

dorkenergy August 14, 2009 at 3:15 pm

Obviously, a statistician “fudging” the truth again. Mathematicians know pie are squared.

jenh August 14, 2009 at 5:44 pm

This is going up on my office door Monday.

Laszlo Thoth August 14, 2009 at 6:16 pm

N, Ryan: The graph is accurate. I ate every bit of the pie represented by the silver-colored wedge in this pie chart. If you think I’m lying you could say that this graph lacks *credibility*, but not accuracy. This is at worst an accurate visual representation of a dubiously credible claim.

James Grenning August 15, 2009 at 8:03 am

You inspired me to create an Accurate Bar Chart.

Previous post:

Next post: