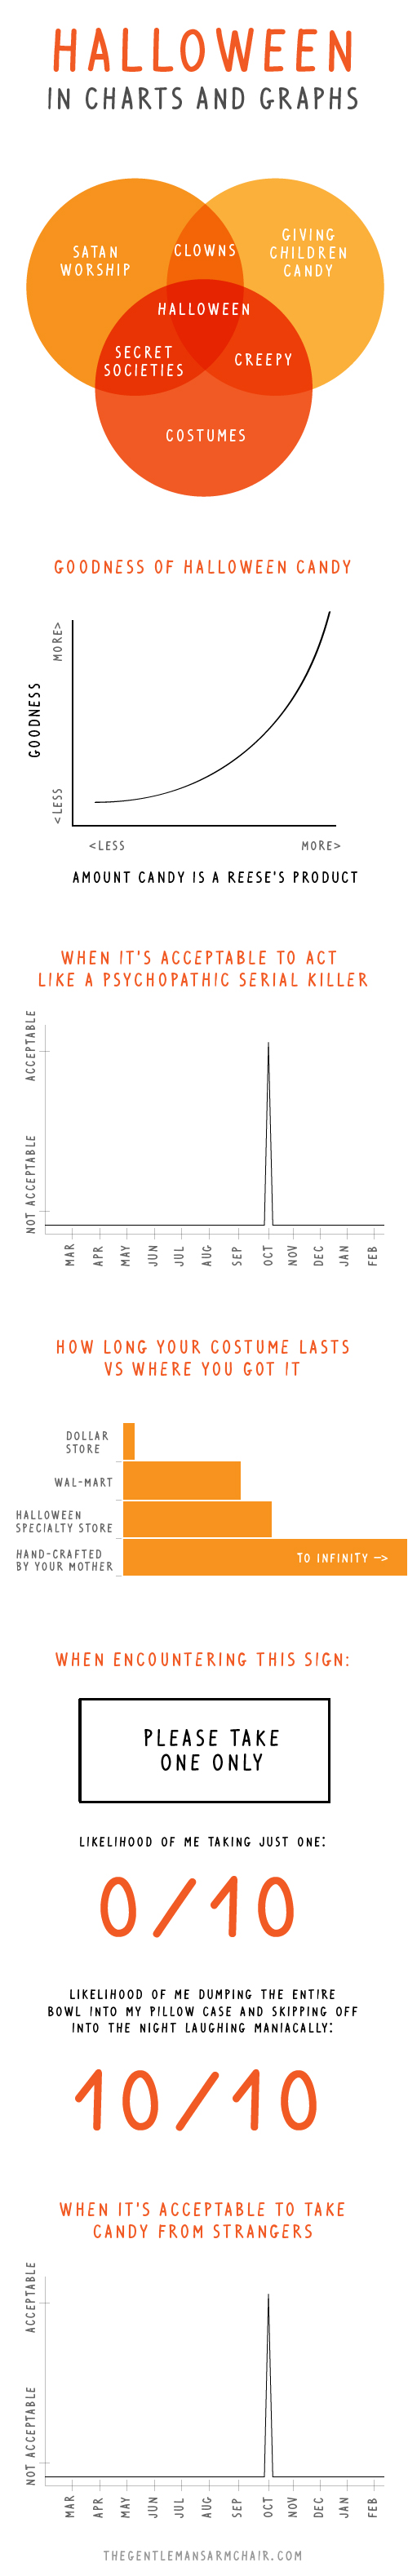
Halloween in Charts and Graphs, An InfographicE.D.W. LynchOctober 29, 2013 The Gentlemans Armchair has created an infographic that takes a look at Halloween through a series of charts and graphs. via Tastefully Offensive Related Posts E.D.W. Lynch Writer and humor generalist on the Internet and on Facebook. Recent Posts A Latin Dance Style Cover of the Classic Cream Song ‘Sunshine of Your Love’ Amusing Home Security Footage Presented as a David Attenborough Nature Documentary Caretaker Feeds Grapes to Hungry Hanging Bats A Campy Instructional Film About How to Use a Sidewalk Creative Cat Makes Clay Pottery With His Artistic Human ‘The Hobbit’ Read in the Same Style As a BBC Radio 4 Shipping Forecast Managed WordPress at Laughing Squid Hosting host your website with Laughing Squid