
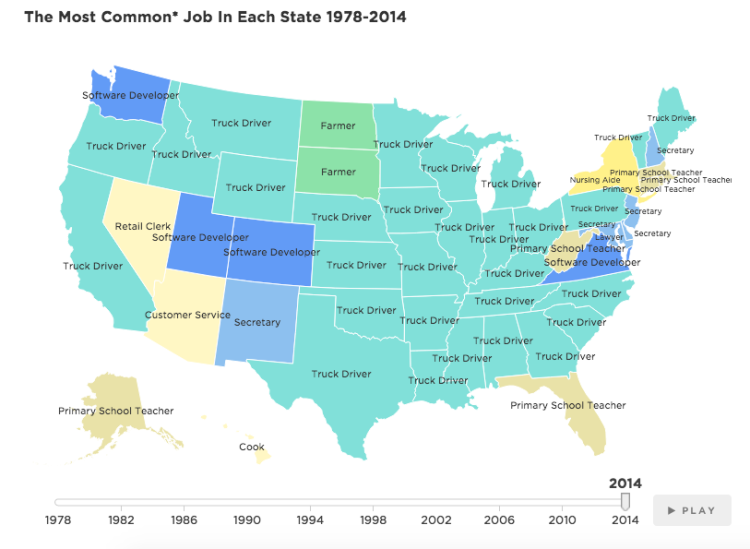
NPR’s Planet Money has created an interesting interactive map that shows the most common jobs in each state in the United States between 1978 through 2014. Using data from the Census Bureau and IPUMS-CPS/University Of Minnesota, the map and its related chart shows the country’s drift away from administrative jobs and into trucking professions.
What’s with all the truck drivers? Truck drivers dominate the map for a few reasons. Driving a truck has been immune to two of the biggest trends affecting U.S. jobs: globalization and automation. A worker in China can’t drive a truck in Ohio, and machines can’t drive cars (yet). …The prominence of truck drivers is partly due to the way the government categorizes jobs. It lumps together all truck drivers and delivery people, creating a very large category. Other jobs are split more finely; for example, primary school teachers and secondary school teachers are in separate categories.
image via NPR’s Planet Money