
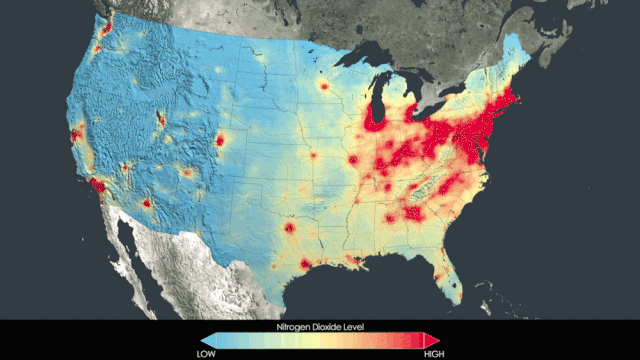
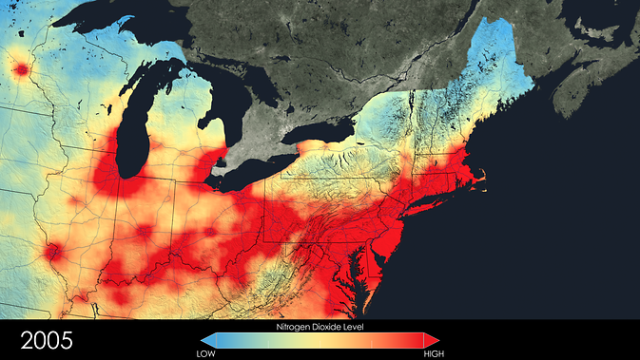
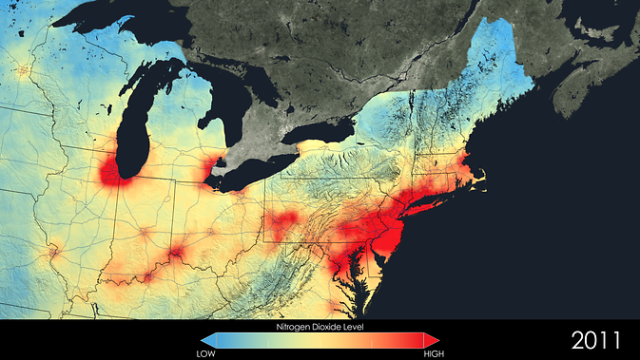
NASA has a series of images taken from data collected by the Ozone Monitoring Instrument (OMI) on their Aura satellite that showcase the improving air quality in the United States from 2005 to 2011. Specifically, the images provide a visualization for a yearly decrease in nitrogen dioxide. More images are available in NASA’s post about them.
Nitrogen dioxide is one of the six common pollutants regulated by the U.S. Environmental Protection Agency (EPA) to protect human health. Alone it can impact the respiratory system, but it also contributes to the formation of other pollutants including ground-level ozone and particulates, which also carry adverse health effects. The gas is produced primarily during the combustion of gasoline in vehicle engines and coal in power plants. It’s also a good proxy for the presence of air pollution in general.
images via NASA Goddard’s Scientific Visualization Studio/T. Schindler
via Boing Boing